Tracing
The application you deployed in the previous step has been configured to use the Zipkin tracing protocol. Let’s curl the Web endpoint to generate some traces.
Remember; if you are using the Shipyard Visual studio code environment or Instruqt use
dockerhostinstead oflocalhost! On Instruqt, the UIs referenced in this section are also conveniently open for you in the Instruqt UI
➜ curl localhost:9090
{
  "name": "web",
  "uri": "/",
  "type": "HTTP",
  "start_time": "2019-11-18T15:01:32.655519",
  "end_time": "2019-11-18T15:01:32.710236",
  "duration": "54.7199ms",
  "body": "Hello World",
  "upstream_calls": [
    {
      "name": "api-v1",
      "uri": "http://localhost:9091",
      "type": "HTTP",
      "start_time": "2019-11-18T15:01:32.691269",
      "end_time": "2019-11-18T15:01:32.707108",
      "duration": "15.8386ms",
      "body": "Response from API v1",
      "upstream_calls": [
        {
          "uri": "http://localhost:9091",
          "code": 200
        }
      ],
      "code": 200
    }
  ],
  "code": 200
}
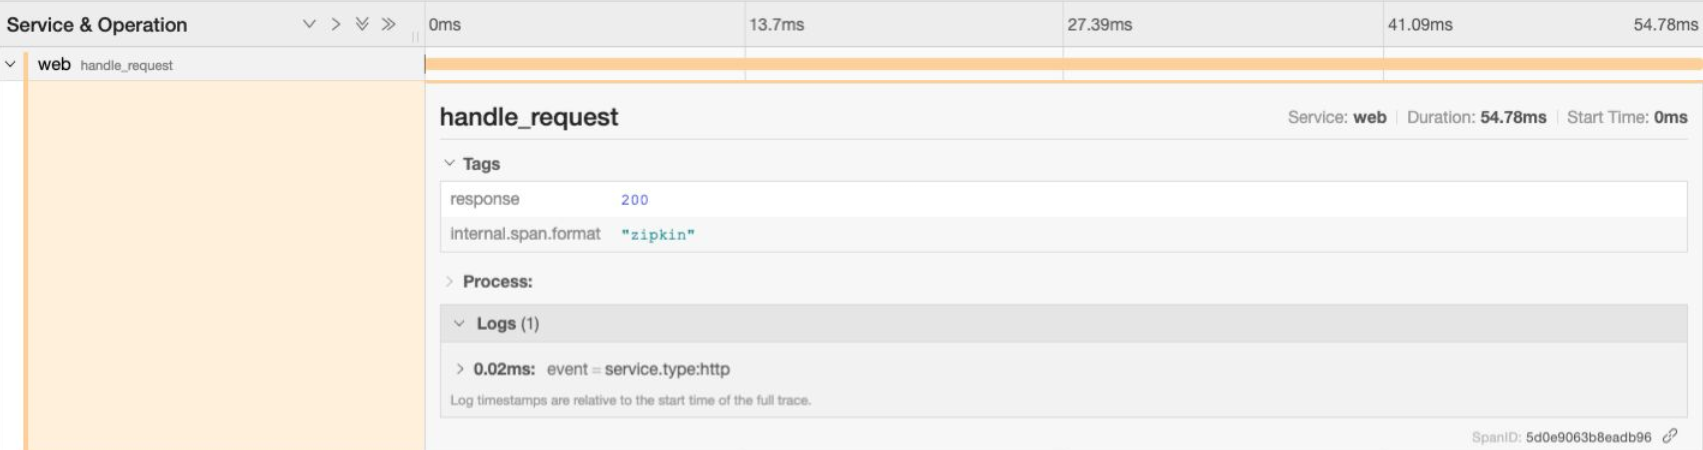
Jaeger has been configured to collect and visualize the traces, all spans are sent are transmitted from the applications and Envoy proxies and are collected in Jaeger. If you look at the Jaeger UI, and view a trace from the web service you will see the individual spans which make up a trace.
localhost:16686/search?service=web

Traces are broken up into individual spans which relate to an action or function. The spans can have metadata in the form of Tags, and Logs attached to them. Click on one of the spans to see the metadata.
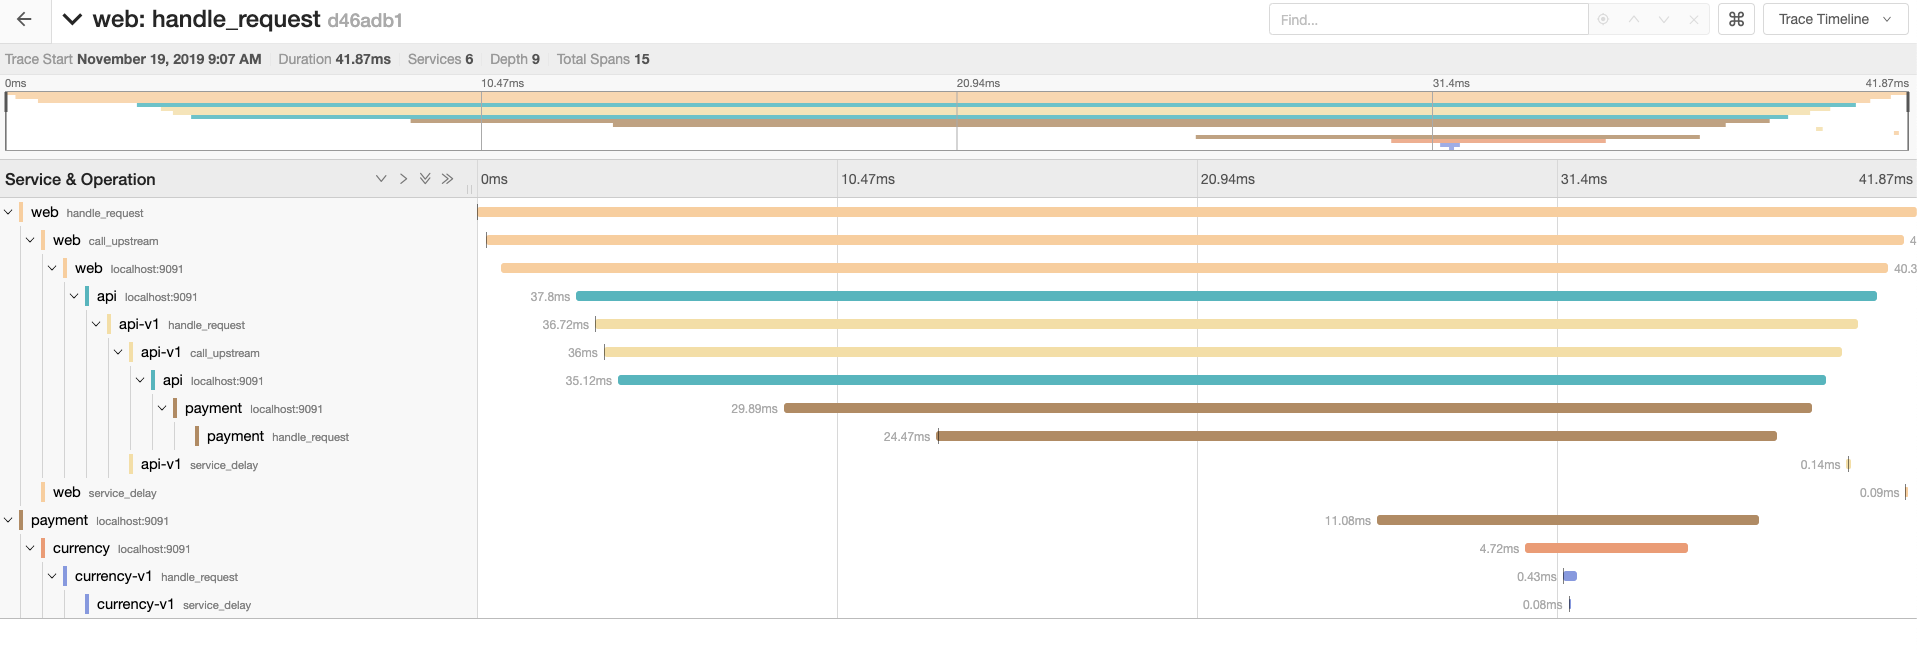
Spans are related by their ID, when a new span is created the ID of the parent is associated with it. The entire trace is not transmitted to the server in a single document, as a trace can contain spans for multiple different services. Instead each span is transmitted to the server individually, it is the relation between parent and child which allows Jaeger to be able to reconstruct the individual spans into a trace.
When you are creating spans in code, you can easily create child spans as the relation can be passed using the OpenTracing API. The problem is how do you pass the span id to an external service, like when you call an upstream API? An example of this problem can be seen with the Payment and Currency service in the example app.
If you look at the trace, the last span in the chain is the payments span which has been created by the Envoy proxy in the service mesh. However; the full call chain should be Web -> API -> Payment -> Currency. The spans for Payments and Currency can be found in the Jaeger UI if you select them in the Service search box, but they are detached from the main trace.
The reason behind this is that the Payment service is not aware of any parent span id from the API service.
To rectify this situation we need to do two things:
- When making a call to an upstream service we pass the span id, trace id, and parent span id as HTTP headers. https://github.com/openzipkin/b3-propagation.
- When handling requests we need to look for the presence of the zipkin headers, and use this information when creating a new span.
X-B3-TraceId: 80f198ee56343ba864fe8b2a57d3eff7
X-B3-ParentSpanId: 05e3ac9a4f6e3b90
X-B3-SpanId: e457b5a2e4d86bd1
X-B3-Sampled: 1
Thankfully the OpenTracing SDK makes this process nice and simple.
Open the handler.go file in the payments-service folder and add the following code to line 14. This code automatically extracts the headers from the request and creates a SpanContext. You can then use this when creating the span.
// attempt to create a span using a parent span defined in http headers
	wireContext, err := opentracing.GlobalTracer().Extract(
		opentracing.HTTPHeaders,
		opentracing.HTTPHeadersCarrier(r.Header),
	)

	if err != nil {
		// if there is no span in the headers an error will be raised, log
		// this error
		logger.Debug("Error obtaining context, creating new span", "error", err)
	}
Modify the StartSpan block to add the additional option ext.RPCServerOption, this will associate the new Span with the details from the inbound request.
	// Create the span referring to the RPC client if available.
	// If wireContext == nil, a root span will be created.
	serverSpan := opentracing.StartSpan(
		"handle_request",
		ext.RPCServerOption(wireContext))
You will also need to import the ext package, add the following to your handler.go import statements.
"github.com/opentracing/opentracing-go/ext"
In the same way that the parent span is not automatically inferred from the headers, the span id and other headers are not automatically added to the outbound request. We can add this information again using the OpenTracing API. First we are creating a new clientSpan using the context of the parent span’s context. We then add some logging for the upstream type. The SetKindRPCClient, HTTPUrl, and HTTPMethod methods are convenience methods which set default tag for us.
Where things get interesting is the Inject method call. What we are doing in this method call is injecting the headers for the Zipkin span as HTTP headers in our request. The nice thing about OpenTracing is that this workflow remains the same, not matter which tracing system you are using.
Add the following code to line 29 in handler.go:
clientSpan := opentracing.StartSpan(
	"call_upstream",
	opentracing.ChildOf(serverSpan.Context()),
)

clientSpan.LogFields(log.String("upstream.type", "http"))

ext.SpanKindRPCClient.Set(clientSpan)
ext.HTTPUrl.Set(clientSpan, req.URL.String())
ext.HTTPMethod.Set(clientSpan, req.Method)

// Transmit the span's TraceContext as HTTP headers on our
// outbound request.
opentracing.GlobalTracer().Inject(
	clientSpan.Context(),
	opentracing.HTTPHeaders,
	opentracing.HTTPHeadersCarrier(req.Header))
You will also need to add the following import to the imports declaration at the top of handler.go:
"github.com/opentracing/opentracing-go/ext"
You can now re-build the application, the build will complete 100% in Docker using a multistage build, if you go to your terminal in the payments-service folder and execute the following command to build a new version and tag it as v2.0.0.
docker build -t nicholasjackson/broken-service:v2.0.0 .
Sending build context to Docker daemon  8.032MB
Step 1/10 : FROM golang:alpine
 ---> 3024b4e742b0
Step 2/10 : COPY . /go/src/github.com/hashicorp/consul-service-mesh-for-developer/payment-service
 ---> 3ecd14dc6eef
Step 3/10 : WORKDIR /go/src/github.com/hashicorp/consul-service-mesh-for-developer/payment-service
 ---> Running in 10649f33c839

#...

Removing intermediate container 524e1417ed99
 ---> 1e5194aff731
Successfully built 1e5194aff731
Successfully tagged nicholasjackson/broken-service:v2.0.0
You can now deploy the new version of the service. To avoid having to push the Docker image to a remote repository we can use the shipyard push command to push the image to Kubernetes image cache. Run the following command in your terminal.
➜ yard push --image nicholasjackson/broken-service:v2.0.0
## Pushing image nicholasjackson/broken-service:v2.0.0 to cluster shipyard
Now let’s deploy the new version to our Kubernetes cluster, the file payments_blue.yml in the 2_tracing folder already has been updated with the reference to the new image which you have just built.
containers:
- name: payment
  image: nicholasjackson/broken-service:v2.0.0
  imagePullPolicy: IfNotPresent
  ports:
  - containerPort: 8080
  env:
  - name: "TRACING_ZIPKIN"
    value: "http://jaeger:9411"
  - name: "CURRENCY_ADDR"
    value: "http://localhost:9091"
Deploy the updated application using kubectl:
➜ kubectl apply -f ./2_tracing/payments_blue.yml
deployment.apps/payment-deployment-blue configured
Again let’s curl the service to capture some traces.
➜ curl localhost:9090
{
  "name": "web",
  "uri": "/",
  "type": "HTTP",
  "start_time": "2019-11-19T09:02:51.138696",
  "end_time": "2019-11-19T09:02:51.194127",
  "duration": "55.4355ms",
  "body": "Hello World",
  "upstream_calls": [
    {
      "name": "api-v1",
      "uri": "http://localhost:9091",
      "type": "HTTP",
      "start_time": "2019-11-19T09:02:51.146530",
      "end_time": "2019-11-19T09:02:51.191146",
      "duration": "44.6169ms",
      "body": "Response from API v1",
      "upstream_calls": [
        {
          "uri": "http://localhost:9091",
          "code": 200
        }
      ],
      "code": 200
    }
  ],
  "code": 200
}
When you again look at the traces http://localhost:16686/search?service=web you should now see the Payment, and Currency services correctly showing as part of the trace.
Summary
In this section we have seen that in order to create meaninful traces, there is a dependency on you to add hooks into your applciation code to tie all the spans together. One thing we did not do in this section is safely deploy our application. We will see how you do that next.